What You Get in a Brick360 Report and How It Stops Your Real Estate Mistakes
Use the Brick360 Report to compare Bangalore projects side by side, identify red flags, and negotiate prices with verified data insights.

Key Takeaway
Brick360 Report Card gives you essential data points and red flags you likely won’t ever see in brochures, helping you avoid pitfalls like delays, overpricing, missing amenities, or legal surprises. Here are its features and how each protects you as a buyer in Bangalore.
What problems buyers often face
Imagine this: you like a new project, talk prices, and are about to pay the booking amount, but then you hear news around similar properties like:
- Possession delayed by 1–2 years
- Amenities promised (clubhouse, lifts, water backup) never delivered
- Legal or title issues are burying the resale potential
- Infrastructure announcements (metro, highway) that are just promises
- Hidden costs like parking, maintenance, and poor commute times
These are the mistakes many buyers make because they lack reliable, consolidated data.
The BrickFi Report Card was built to solve this problem. Instead of scattered, biased data, it gives you a structured, balanced view of a property in five clear sections.
Price & Units
What you see:
- Base price per sq. ft (e.g., ₹14,613/sq.ft)
- Available configurations: 3 BHK, 4 BHK, 5 BHK
- Unit-level details: built-up area, price range, and floor plans (2D + 3D)
How this helps you avoid mistakes:
- Prevents overpaying: You can compare cost vs. space across unit types.
- Clears hidden costs: Unit-level prices stop builders from masking true per sq. ft rates.
- Helps shortlisting: Floor plans (2D + 3D) make it easier to visualize and compare.
Get instant access to expert, data-driven property insights.
Request your free Brickfi investment report now and make smarter real estate decisions today.
Brick360 Ratings
What you see: Every project is scored across four pillars (out of 5):
- Location → Schools, offices, conveniences, connectivity
- Developer → Experience, delivery record, customer satisfaction
- Property → Amenities, density, surroundings
- Financials → Price point, rental income, growth potential
How this helps you avoid mistakes:
- Protects against delays: Developer score shows whether a builder has a history of broken timelines.
- Avoids brochure bias: Property scores balance glossy amenities against real density and surroundings.
- Secures your ROI: Financials help investors separate overpriced projects from value buys.
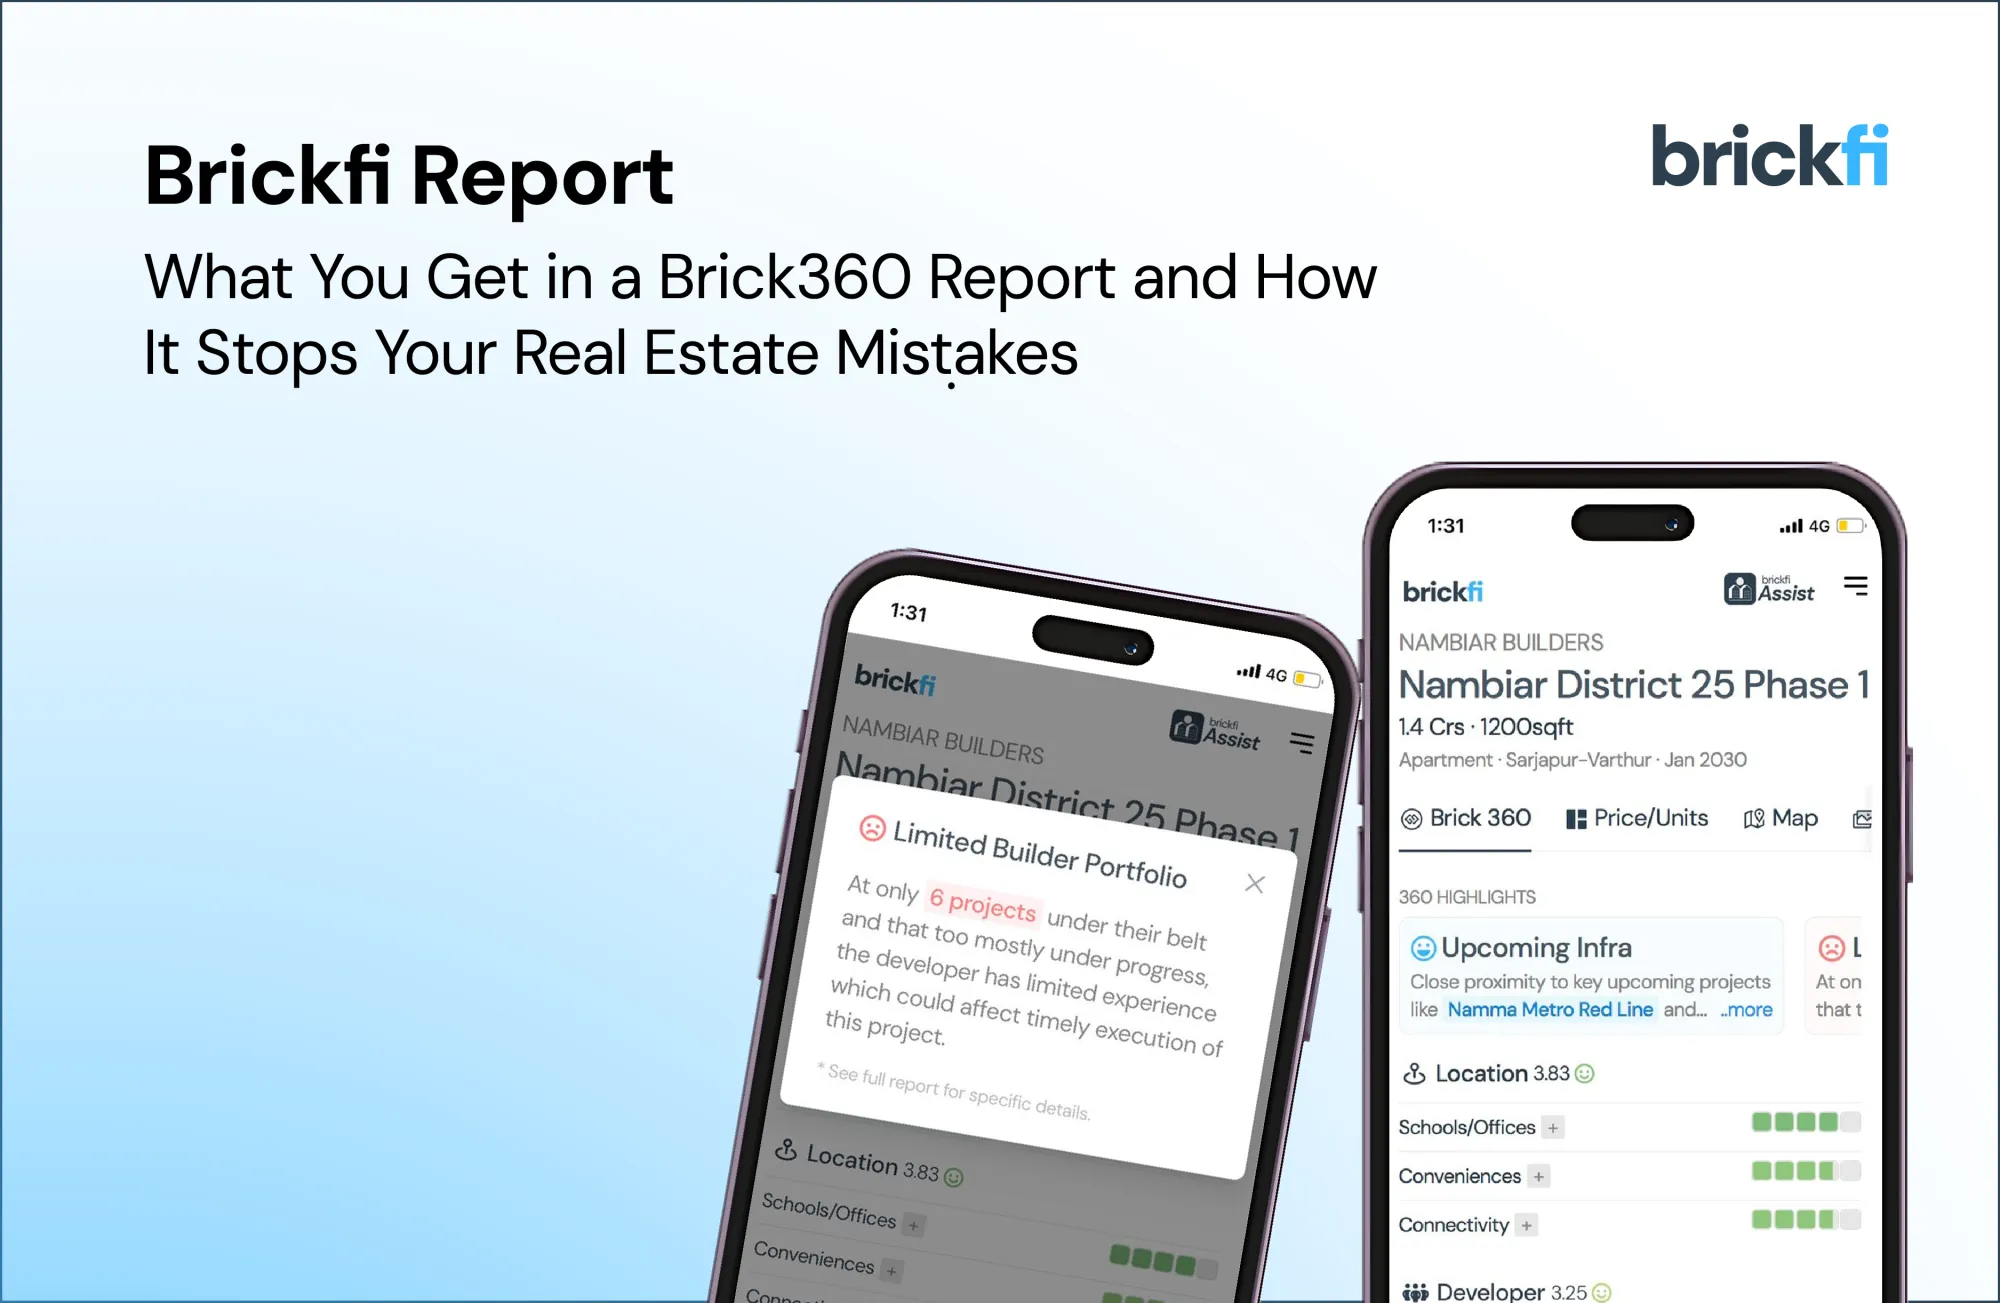
360° Highlights
What you see: A quick pros & cons snapshot. For example:
- ✅ Premium Property (larger unit sizes)
- ✅ Prime Location (close to IT hubs and offices)
- ✅ Strong Developer Track Record (70+ projects)
- ❌ Missing Metro (nearest station is not very close)
How this helps you avoid mistakes:
- Saves time: You don’t need to read every section to get the big picture.
- Flags deal-breakers: If a missing metro or lack of amenities is critical for you, you know upfront.
- Sharpens decisions: Investors can scan highlights to compare multiple projects faster.
Maps & Location Intelligence
What you see: Interactive maps with multiple layers:
- Schools → Travel times to CBSE, ICSE, international, universities
- Workplaces → Commute to Whitefield, ORR, Electronic City, IT parks
- Conveniences → Hospitals, malls, shopping, daily needs
- Growth Potential → Infra push, tech parks, demand hotspots
- Connectivity → Roads, metro access, water bodies nearby
How this helps you avoid mistakes:
- Cuts through sales talk: Brochures promise “10 minutes from everywhere.” Maps show real travel times with traffic.
- Identifies true growth areas: Growth filters distinguish between operational infra and just proposed plans.
- Reduces lifestyle shocks: Buyers know in advance if schools, hospitals, or essentials are too far.
2D & 3D Floor Plan Renders
What you see: Each unit card includes floor plans in both formats:
- 2D (technical layouts): Exact room dimensions, wall placement, flow of space.
- 3D (furnished renders): Lifestyle view with furniture, interiors, and livability.
How this helps you avoid mistakes:
- Ensures technical accuracy so you don’t miss layout inefficiencies.
- Lets you visualize how furniture fits and how the home will actually feel.
- Helps compare units beyond numbers, making sure space translates into real usability.
How to Use Your BrickFi Report
1. Compare Shortlisted Projects Side by Side
Don’t stop at just one property. Generate reports for at least 2–3 projects in the same area.
- Compare Brick360 Ratings across Location, Developer, Property, and Financials.
- See how each project performs not only in lifestyle fit but also in long-term investment value.
- This gives you an objective comparison instead of relying on sales pitches.
Get instant access to expert, data-driven property insights.
Request your free Brickfi investment report now and make smarter real estate decisions today.
2. Start with Red Flags and Highlights
The 360° Highlights section distills the report into clear pros and cons.
- Look for red flags like missing occupancy certificates or weak metro connectivity.
- Pay attention to positives such as strong builder track records or premium unit sizes. This quick filter lets you eliminate poor fits early and focus on serious contenders.
3. Use Pricing and Rental Benchmarks in Negotiation
One of the biggest buyer mistakes is overpaying.
- The report shows price per sq. ft. vs. area average and recent transactions.
- It also provides expected rental yields for investors. Use these benchmarks as negotiation leverage with the builder or broker. If a property is overpriced, you’ll have data-backed evidence to bargain.
4. Match Livability Metrics to Your Lifestyle
Numbers alone don’t define a good home. The Maps & Location Intelligence section shows real-world livability.
- Commute times to your workplace and your children’s school.
- Proximity to quality hospitals, shopping, and conveniences.
- Environmental factors like lakes, pollution hotspots, or congestion. Use this to check if the property actually fits your daily life — not just your budget.
5. Double-Check Legal and Developer Risks
The Legal & Compliance and Developer Ratings are critical for peace of mind.
- If the report shows pending approvals or multiple complaints, ask for official documents.
- For developers with delay histories, demand penalty clauses in your agreement.
- For low-confidence items, consult a lawyer to confirm. This ensures you avoid future disputes or resale headaches.
6. Plan Long-Term, Not Just the Purchase
Finally, use the Financials rating to think beyond the booking:
- Will rental yields justify the investment?
- Is there enough growth potential in that micro-market?
- Does the property align with your 5–10 year life plan (career, family, liquidity)? This prevents emotional purchases and keeps your decision grounded in long-term strategy.
The BrickFi Report Card simplifies this by turning complexity into clarity. With structured sections, Price, Ratings, Highlights, Maps, and Transparent Comparisons, it gives you everything you need to make a confident, mistake-free decision.
Final Thoughts
Brick360 isn’t about tech or complexity. It’s about giving you exactly the insights you need to avoid the common traps in Bangalore real estate: delays, overpricing, legal risk, and broken promises.
Every data point in the report card is a shield helping you buy not just beautifully, but wisely.
FAQs
Can I compare multiple projects using the report?
Yes, BrickFi reports are structured for side-by-side comparison across all five sections.
Is this useful only for new projects?
No. Resale properties also benefit from pricing benchmarks, location scores, and livability insights.
How reliable is the data?
All data comes from RERA, government records, market transactions, and verified sources.
Get instant access to expert, data-driven property insights.
Request your free Brickfi investment report now and make smarter real estate decisions today.