Decoding Bangalore’s North vs South Investment Potential
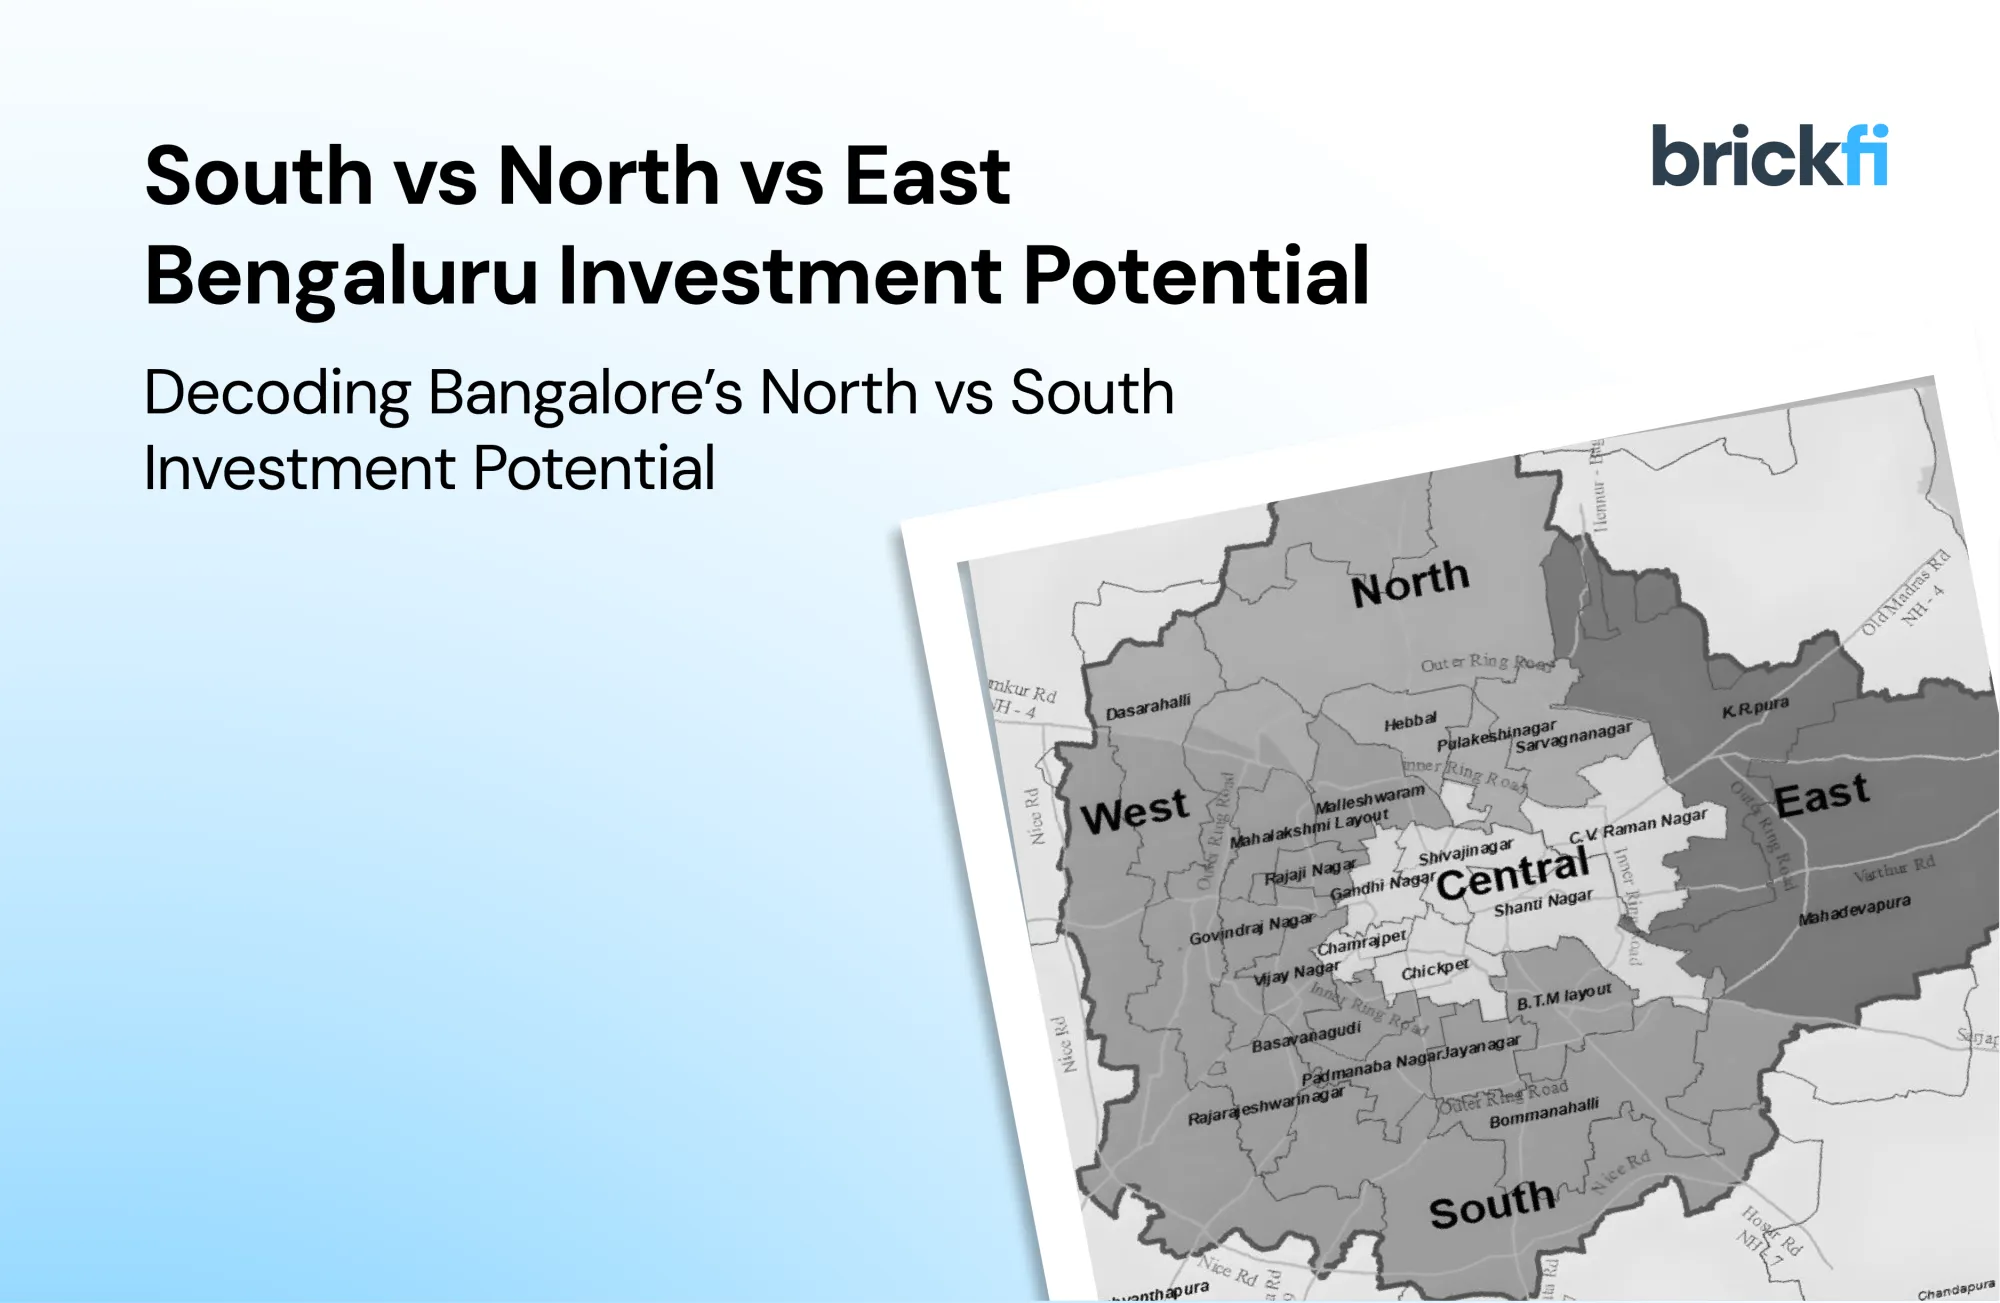
Comparative Analysis of North, South and East Bengaluru For 2025–2030
Key Takeaway
Bengaluru is no longer a single market. North, South, and East each have distinct drivers, buyer profiles and risk patterns. North is the long runway story around the airport, logistics, and new commercial clusters. South is the end-user stronghold with deep social infrastructure and stable demand. East is the tech engine anchored by ORR and Whitefield, with the tightest link between jobs and housing. If you evaluate each zone with data rather than sentiment, you can build a five-year portfolio that balances appreciation, yield, and liquidity. BrickFi’s 360° Report helps you do that by turning scattered facts into clear, comparable scores across Location, Developer, Property, and Financials.
How to read Bengaluru by zones
Think in layers. Employment hubs create daily demand. Mass transit cuts commute friction. Social infrastructure keeps end-users anchored. Supply discipline supports prices. Your job is to find pockets where at least three of these four layers line up.
Snapshot at a glance
Use this as a quick mental model before diving deep.
Get instant access to expert, data-driven property insights.
Request your free Brickfi investment report now and make smarter real estate decisions today.
Price trend patterns over five years
Prices in the East have followed employment demand closely. When ORR and Whitefield absorb more office space, nearby residential prices and rents tend to move first. North has seen step-ups around each airport and metro milestone, but appreciation is uneven across pockets. South shows the most stable laddering, with inner-south neighborhoods compounding gradually and peripheral belts reacting to metro and highway upgrades. None of these patterns works in isolation. A weaker builder in a strong micro-market underperforms, and a good builder in a lagging pocket struggles on resale. This is why you need property-level evaluation, not just area talk.
North Bengaluru in depth
Where buyers look
Hebbal and Yelahanka for ready and near-ready options with strong social infrastructure. Jakkur and Thanisandra for mid-to-premium apartments close to the airport spine. Devanahalli and the broader airport region for plotted developments, villas and large townships with longer horizons.
What moves the needle
Airport expansion, express connectivity and upcoming metro corridors shape sentiment. Large land parcels allow master-planned communities with better amenities and density. Corporate campuses and warehousing add a diverse tenant base over time.
Who should buy here
Investors who can hold for five to seven years, NRI buyers comfortable with township formats, and upgrade end-users who value larger homes, green pockets and airport access.
Where to be careful
Outer pockets that price in future infrastructure too early. Projects where metro access is only proposed, with no visible execution. Segments with aggressive supply that could cap near-term rent growth.
BrickFi angle
Use BrickFi Maps to verify real travel times to Hebbal and key office clusters. Check Developer scores for on-time delivery experience in North. Use Financials to benchmark rent expectations around airport belts versus Hebbal-centric apartments. Read 360° Highlights to see if the metro proximity is operational, under construction or only planned.
Get instant access to expert, data-driven property insights.
Request your free Brickfi investment report now and make smarter real estate decisions today.
South Bengaluru in depth
Where buyers look
Jayanagar and JP Nagar for end-user certainty and liquidity. Bannerghatta Road and Kanakapura Road for value-to-mid premium homes with improving transit. Electronic City and Bommasandra for lower entry prices tied to tech and industrial employment.
What moves the needle
Density of schools and hospitals, neighborhood maturity, and expanding metro reach across South corridors. In pockets like JP Nagar and Jayanagar, the depth of end-user demand keeps resale healthy even when new supply slows.
Who should buy here
First-time buyers who want stability and everyday convenience. Families prioritizing school catchments and healthcare access. Yield-seeking investors near Electronic City after the metro link is live.
Where to be careful
Peripheral stretches where social infrastructure lags. Projects overpromising connectivity that is several years out. Value segments with stretched developer timelines.
BrickFi angle
Lean on Location scores, which capture commute and livability. For Electronic City and Bommasandra, use Price & Units to verify that any premium for metro proximity is justified by plan and progress. For inner-south, Financials can help you weigh lower rental yields against superior liquidity.
Get instant access to expert, data-driven property insights.
Request your free Brickfi investment report now and make smarter real estate decisions today.
East Bengaluru in depth
Where buyers look
Whitefield and KR Puram for ready stock near operational metro. Varthur and Hoodi for premium mid-rise communities with strong rental pipelines. Sarjapur Road for the East-South bridge connecting to ORR employment.
What moves the needle
Office absorption on ORR and in Whitefield, operational metro in Purple Line extensions, and a strong ecosystem of schools, healthcare, and retail. East offers the clearest line of sight from job creation to rental demand.
Who should buy here
Tech professionals planning to live near work. Investors are willing to pay higher entry prices for better tenant depth and lower vacancy. Upgraders targeting club-class amenities and integrated communities.
Where to be careful
Paying too much near marquee junctions without matching livability inside the project. Smaller launches on narrow approach roads that limit last-mile convenience. Projects that depend on future road links to ease existing congestion.
BrickFi angle
Use Brick360 Ratings to sanity-check Property density and Surroundings, not just brochure amenities. Compare unit-level Price per sq. ft. against micro-market peers. In 360° Highlights, weigh practical negatives like weak last-mile or absence of a nearby operational station.
Get instant access to expert, data-driven property insights.
Request your free Brickfi investment report now and make smarter real estate decisions today.
North vs South vs East on the metrics that matter
The following lenses help you compare without bias.
Appreciation potential
North has the longest runway where infrastructure converges with commercial expansion, but appreciation is pocket-specific and timing sensitive. East compounds off employment and transit and tends to reprice first when office demand rises. South compounds more steadily, with inner south behaving like blue-chip neighborhoods and peripheral south catching up as metro coverage deepens.
Rental yields
East generally delivers the deepest tenant pool and faster leasing near IT corridors. North rental demand builds as airport and logistics ecosystems mature and as the metro brings daily commuters closer. South yields vary widely, with Electronic City improving as transit improves and inner-south remaining stable but rarely high.
Liquidity on resale
Inner-south and established East micro-markets have the thickest resale markets, led by end-user families. North’s liquidity improves sharply in Hebbal-Yelahanka belts and in well-run townships, while outer airport belts can require more time to find the right buyer.
Risk heat map
The biggest risks in North are timeline overhangs and over-anticipation. In the South, the risk is quality dispersion in peripheral belts and slow road decongestion. In the East, the risk is paying a premium without resolving last-mile or density trade-offs within the project.
Builder ecosystem and formats
North supports larger townships, villas, and plotted developments because land assembly is feasible. This suits buyers who value scale and amenity stacks. South is a mix of compact mid-rise communities and stand-alone towers, with villa pockets off Kanakapura and Bannerghatta. East concentrates premium mid-rise communities with complete amenity programs and club experiences, aimed squarely at the tech workforce. These format differences affect maintenance costs, association governance, and long-term livability. The BrickFi Report’s Property pillar and density metrics help you compare like-for-like.
Government and civic projects to track
Metro extensions across East and South change commute math and should be verified for status and timelines. Airport express and connecting corridors in North unlock the next wave of job-led housing. Ring road progress affects cross-city freight and passenger flows. Localized road widening, stormwater upgrades, and lake rejuvenation change micro-market livability more than glossy headlines. In every case, use BrickFi Maps to see what is operational, what is under construction, and what is still a proposal.
Taxes, compliance, and regulation
At a city level, stamp duty and registration are uniform, but transaction experience varies by sub-registrar office. RERA gives you baseline protection, but enforcement feels different for each builder and project. Title and OC norms are consistent, yet older layouts and peri-urban belts can have legacy documentation that takes longer to clear. BrickFi’s Legal and Compliance lens highlights the paperwork you should insist on before committing, regardless of zone.
Get instant access to expert, data-driven property insights.
Request your free Brickfi investment report now and make smarter real estate decisions today.
A five-year portfolio split you can actually use
No two investors are the same. Here are three model allocations to balance appreciation, yield and liquidity. Treat them as starting points and adjust based on your constraints.
Conservative
The goal is capital preservation with steady compounding and easy exit. Portfolio idea • 50 percent inner-south apartments in JP Nagar or Jayanagar grade communities with proven livability and resale depth • 30 percent East near operational metro in Whitefield or KR Puram, focusing on end-user floor plans with strong tenant demand • 20 percent North in Hebbal or Yelahanka for a measured exposure to future upside with better current-day access Why it works You anchor the portfolio in markets with the most predictable resale while participating in North’s medium-term growth.
Balanced
The goal is appreciation and yield with manageable risk. Portfolio idea • 35 percent East in Whitefield or ORR East within 800 meters of operational or near-operational stations • 35 percent North across Hebbal and Jakkur or a township in Devanahalli with clear progress and strong developer • 30 percent South in Electronic City or Kanakapura Road focusing on projects with visible transit improvements Why it works You hold exposure to all three engines of value creation and diversify by format and timeline.
Aggressive
Goal is higher appreciation with willingness to hold and manage volatility. Portfolio idea • 45 percent North split between Yelahanka, Jakkur and a high-quality airport-belt township with demonstrated execution • 35 percent East in Sarjapur Road or Varthur where supply is competitive but tenant depth is proven • 20 percent South in Bommasandra or Bannerghatta peripheral belts with clear transit progress and realistic pricing Why it works You overweight future corridors without ignoring rental depth and resale in stronger belts.
How to use BrickFi to pick the right project inside the right zone
Even the best micro-market has weak projects. The quickest way to avoid regret is to evaluate project-by-project with the same yardstick.
- Start with Price & UnitsCheck price per sq. ft by configuration, not just headline price. Compare unit sizes and usable layouts. A fair deal in East can beat an overpriced North launch and vice versa.
- Read Brick360 Ratings Look at Location, Developer, Property and Financials with equal attention. A strong Location score does not compensate for weak Developer or Property density. If Financials are average in a hot belt, your expectation of rent or resale may need adjustment.
- Scan 360° Highlights Use the pros and cons to frame site-visit questions. If the metro is cited, ask whether it is operational or under construction. If a lake or open space is listed, verify status and distance.
- Open Maps and Location Intelligence Measure commute to your actual workplace and school shortlist during peak hours. See if last-mile roads are practical. Check for power lines, drains or bottlenecks that brochures rarely show.
- Compare two or three projects side by side Shortlist across zones and formats. Put one North, one South and one East project next to each other. You will quickly see where you are paying for a story versus paying for substance.
- Validate legal and timelines Ask for RERA registration, sanctioned plans and clarity on OC or CC milestones. If the BrickFi confidence band is low on any critical item, escalate with your lawyer before you pay a rupee.
Putting it all together
If you want stable compounding and easy exits, inner-south and established East belts are your anchors. If you want a calculated sprint, add North where infrastructure and commercial nodes are converging. If you invest for yield, choose East near operational metro or South near strong employment. If you are building a family home, let schools, hospitals and daily commute lead your shortlists before chasing headlines.
Bengaluru rewards discipline. The city’s growth is real, but not every project captures it. Use data to confirm what is real on the ground. Use a consistent framework to compare. Use BrickFi to compress weeks of noise into one clean report so you can decide with confidence.
FAQs
1. Is North or South better for pure appreciation?
Neither is uniformly better. North offers a longer runway around airport and new corridors but needs patience and careful micro-market selection. South compounds steadily where social infrastructure is strong and metro fills the gaps.
2. Where are rental yields strongest?
Near deep employment belts and operational metro. That often means East and parts of South. North improves quickly as each mobility and commercial milestone goes live.
3. Should I buy before or after a metro line is complete?
Buying before can improve returns if the builder is credible and timelines are realistic. If risk tolerance is low, wait until operations start and pay for certainty.
4. How much should I allocate to plotted developments in North?
Treat this as satellite exposure rather than a core holding unless you have a specific plan for development or a longer horizon. Mixed portfolios tend to perform better on liquidity.
5. Does the zone matter more than the builder?
Both matter. Zone gives tailwind, builder delivers the plane. A good builder in a solid micro-market is where compounding feels effortless.
Get instant access to expert, data-driven property insights.
Request your free Brickfi investment report now and make smarter real estate decisions today.